Analysis & Reporting
[avatar-to-video image="https://cdn.carecloud.cz/help/avatar1.png" video="https://cdn.carecloud.cz/help/video/analysis-and-reporting.mp4"]
Understand where your growth comes from, analyze every customer interaction, and anticipate future purchasing behavior. Utilize the perfect combination of analytical and prediction tools to develop the winning strategy with the "Analysis & Reporting" app. Learn to use all of those tools efficiently.
Benefit from analysis going two steps further to predict future purchase behavior. Use it to plan, design, and personalize your marketing campaigns better and promote efficient product combinations.
On this page, you will find descriptions for each "Analysis & Reporting" page and Action Icons user guide in a sub-page on the bottom.
Click on the following icon to enter the "Analysis & Reporting App".

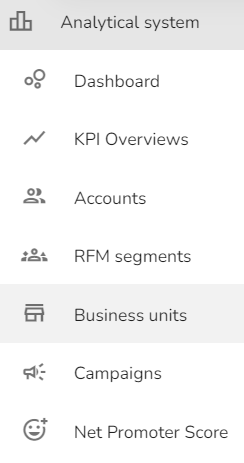
See the overview of the App's pages on the left.

Continue to each page to find their description in detail or to guide on Graphs and Action Icons that you can find in Analysis & Reporting.
Pages
This section provides detailed step-by-step guides for every page of the Analysis & Reporting app. It explains the content of important reports and analysis tools, such as Dashboards, KPI Overviews, RFM Segments, Accounts, Business Units, Campaigns, and Net Promoter Score.
Dashboard
The dashboard gives you a quick and clear overview of how you are doing as a business. Don't miss widgets about Customer Lifetime Value, Business Units Turnover, Churn Rate, Turnover Trends, and much more.
KPI Overviews
Explore detailed widgets about your Overview, Turnover, Purchases Quantity, Average Purchase, and Vouchers Overview. You can find all the valuable information for your reports on these pages. Find out how much the CDP & CRM CareCloud saved and earned you.
RFM Segments
Find out who are your best customers - whom you want to treasure and keep satisfied and who's on the other side of the spectrum - needing encouragement to keep them from cutting and running to your competitors. CDP & CRM Carecloud will group your customers into segments according to their RFM parameters - doing all the work for you! Additionally, we also provide you with tips on how to engage with each segment to improve KPIs. Click here to find out more.
Accounts
Explore your customers' demographic data and enjoy them displayed in clear tables. Six widgets uncover your customers' demographics and group them according to gender, age, what business unit they registered at, or by the last time they purchased.
Business Units
Find comparison of business units — a clear overview of parameters such as new customers, redeemed points, number of purchases, total turnover, and more. Select a time range for which you wish to display the data with the action icon in the top right corner of the page.
Campaigns
Review the results of three campaign types — Email campaigns, SMS campaigns, and Viber Message campaigns. Get all the valuable data about your previous campaigns here. Oversee your campaigns in detail to see what worked and what needs more focus in the upcoming campaigns.
Net Promoter Score
Ask your customers the crucial question to understand their experience with your brand! Net Promoter Score is based on customer feedback and reveals to you how your brand is perceived using one simple question. Click here to read more about NPS.
Guides
This section explains working with the widgets, graphs, and tables within the Analysis & Reporting app. In addition, it explains the action icons and their control to get data on the aspect you are interested in the most.
Action Icons
Read our user guide on action icons to use them efficiently. Master the Calendar, Data View and Segments, Business Units, and Product Groups filters.
Graph Description
Know what to look for in your CDP & CRM CareCloud graphs and their properties so that you can understand your data better. Learn with us how to use graphs to help you succeed.